Comprehensive Project Tracker for NBS Developers

🎯
🧋
Role: Sole Designer
Timeline: 4 Weeks for Dev Front and 2 Weeks for Admin Front
Platform: B2B Web Dashboard
The Context: The "Loss Leader" Strategy
Calculus Carbon acts as a market maker for Nature-based Solutions (NbS).
The Problem: Investors needed real-time data on 10-year projects, but Developers viewed reporting as "unpaid admin work" and relied on scattered Excel sheets.
The Strategy: We built a free, robust project management tool for Developers. By giving them a tool that makes their work easier, we created a silent, real-time data feed for Investors without needing manual email updates.
The Critical Decision: Enforcement over Flexibility
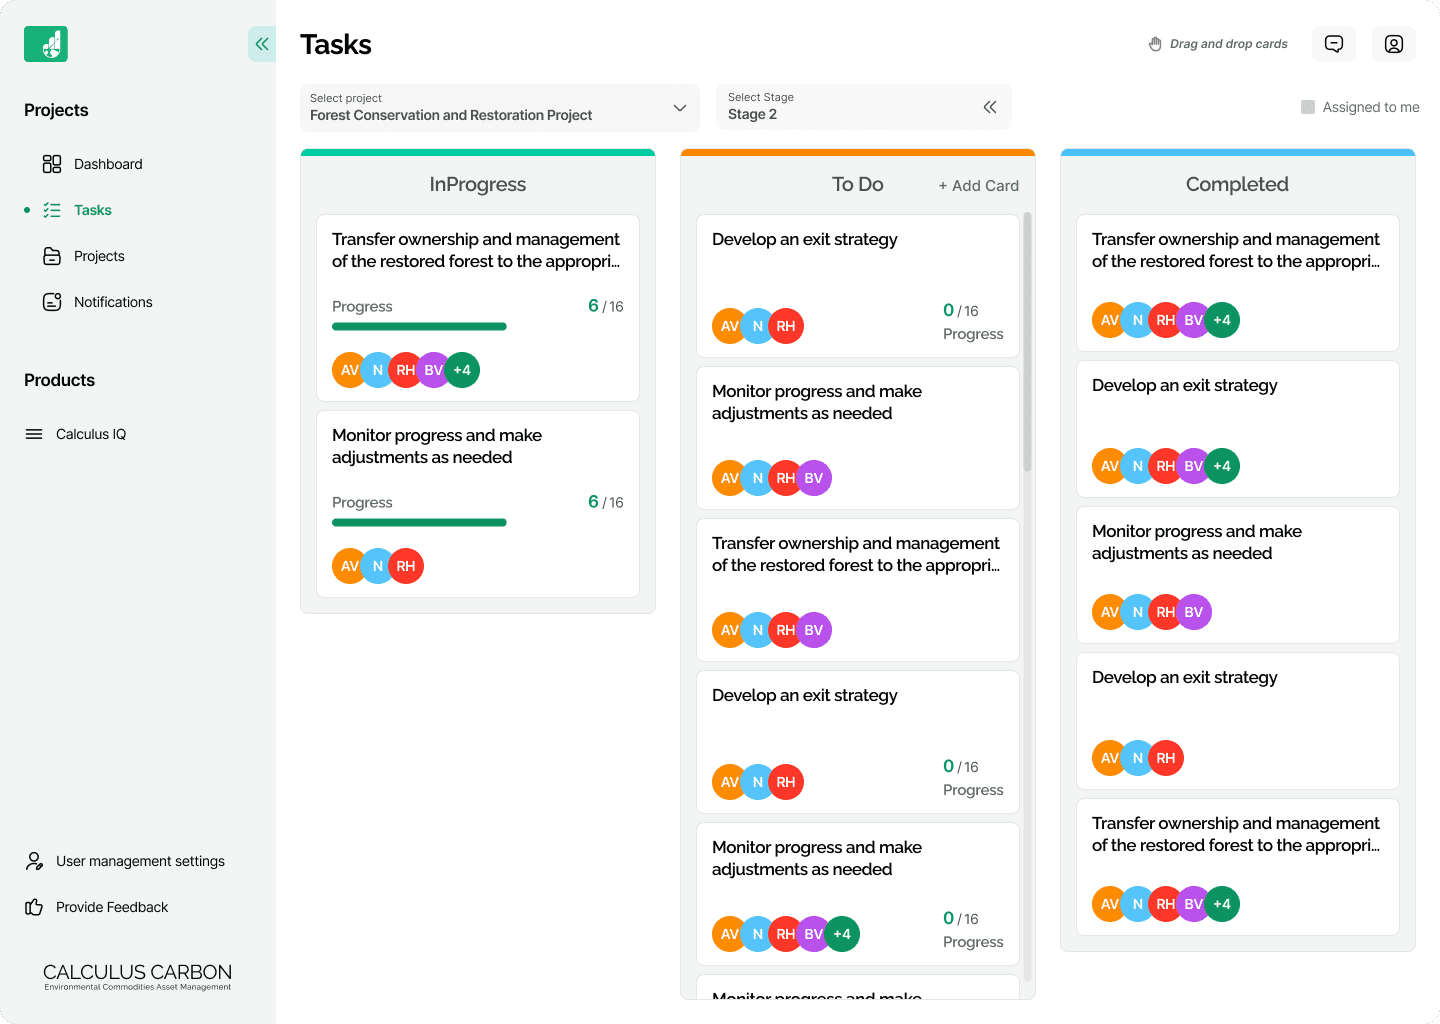
The Conflict: Carbon auditing requires strict compliance. Standard Kanban tools (like Trello) allow users to drag empty cards to "Done," creating false data.
Option A (Discarded): Standard Drag-and-Drop.
Why it failed: It prioritized speed over integrity. Users could mark tasks "Complete" without submitting required proofs.
Option B (Selected): Logic-Gated Workflows.
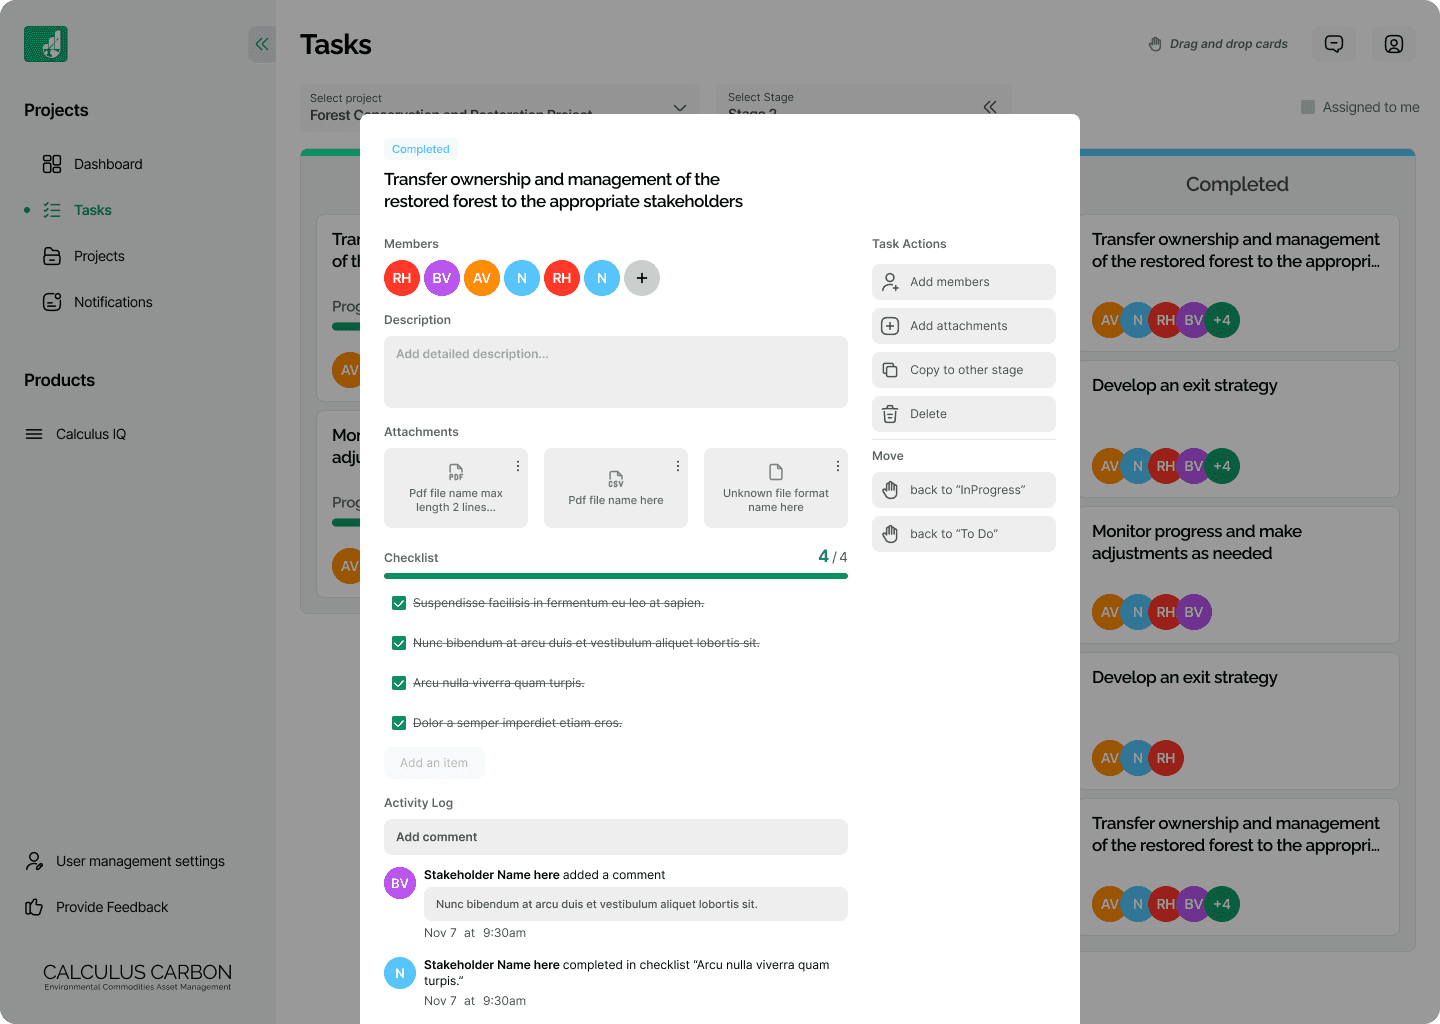
The Pivot: I designed Conditional Interactivity. A task card is locked and cannot be dragged to "Completed" unless 100% of the checklist items are marked done.
The Visual Cue: To differentiate status instantly, "To-Do" cards display the actionable Checklist, while "In-Progress" cards auto-switch to a visual Progress Bar.
The Solution: Managing Scale & Security
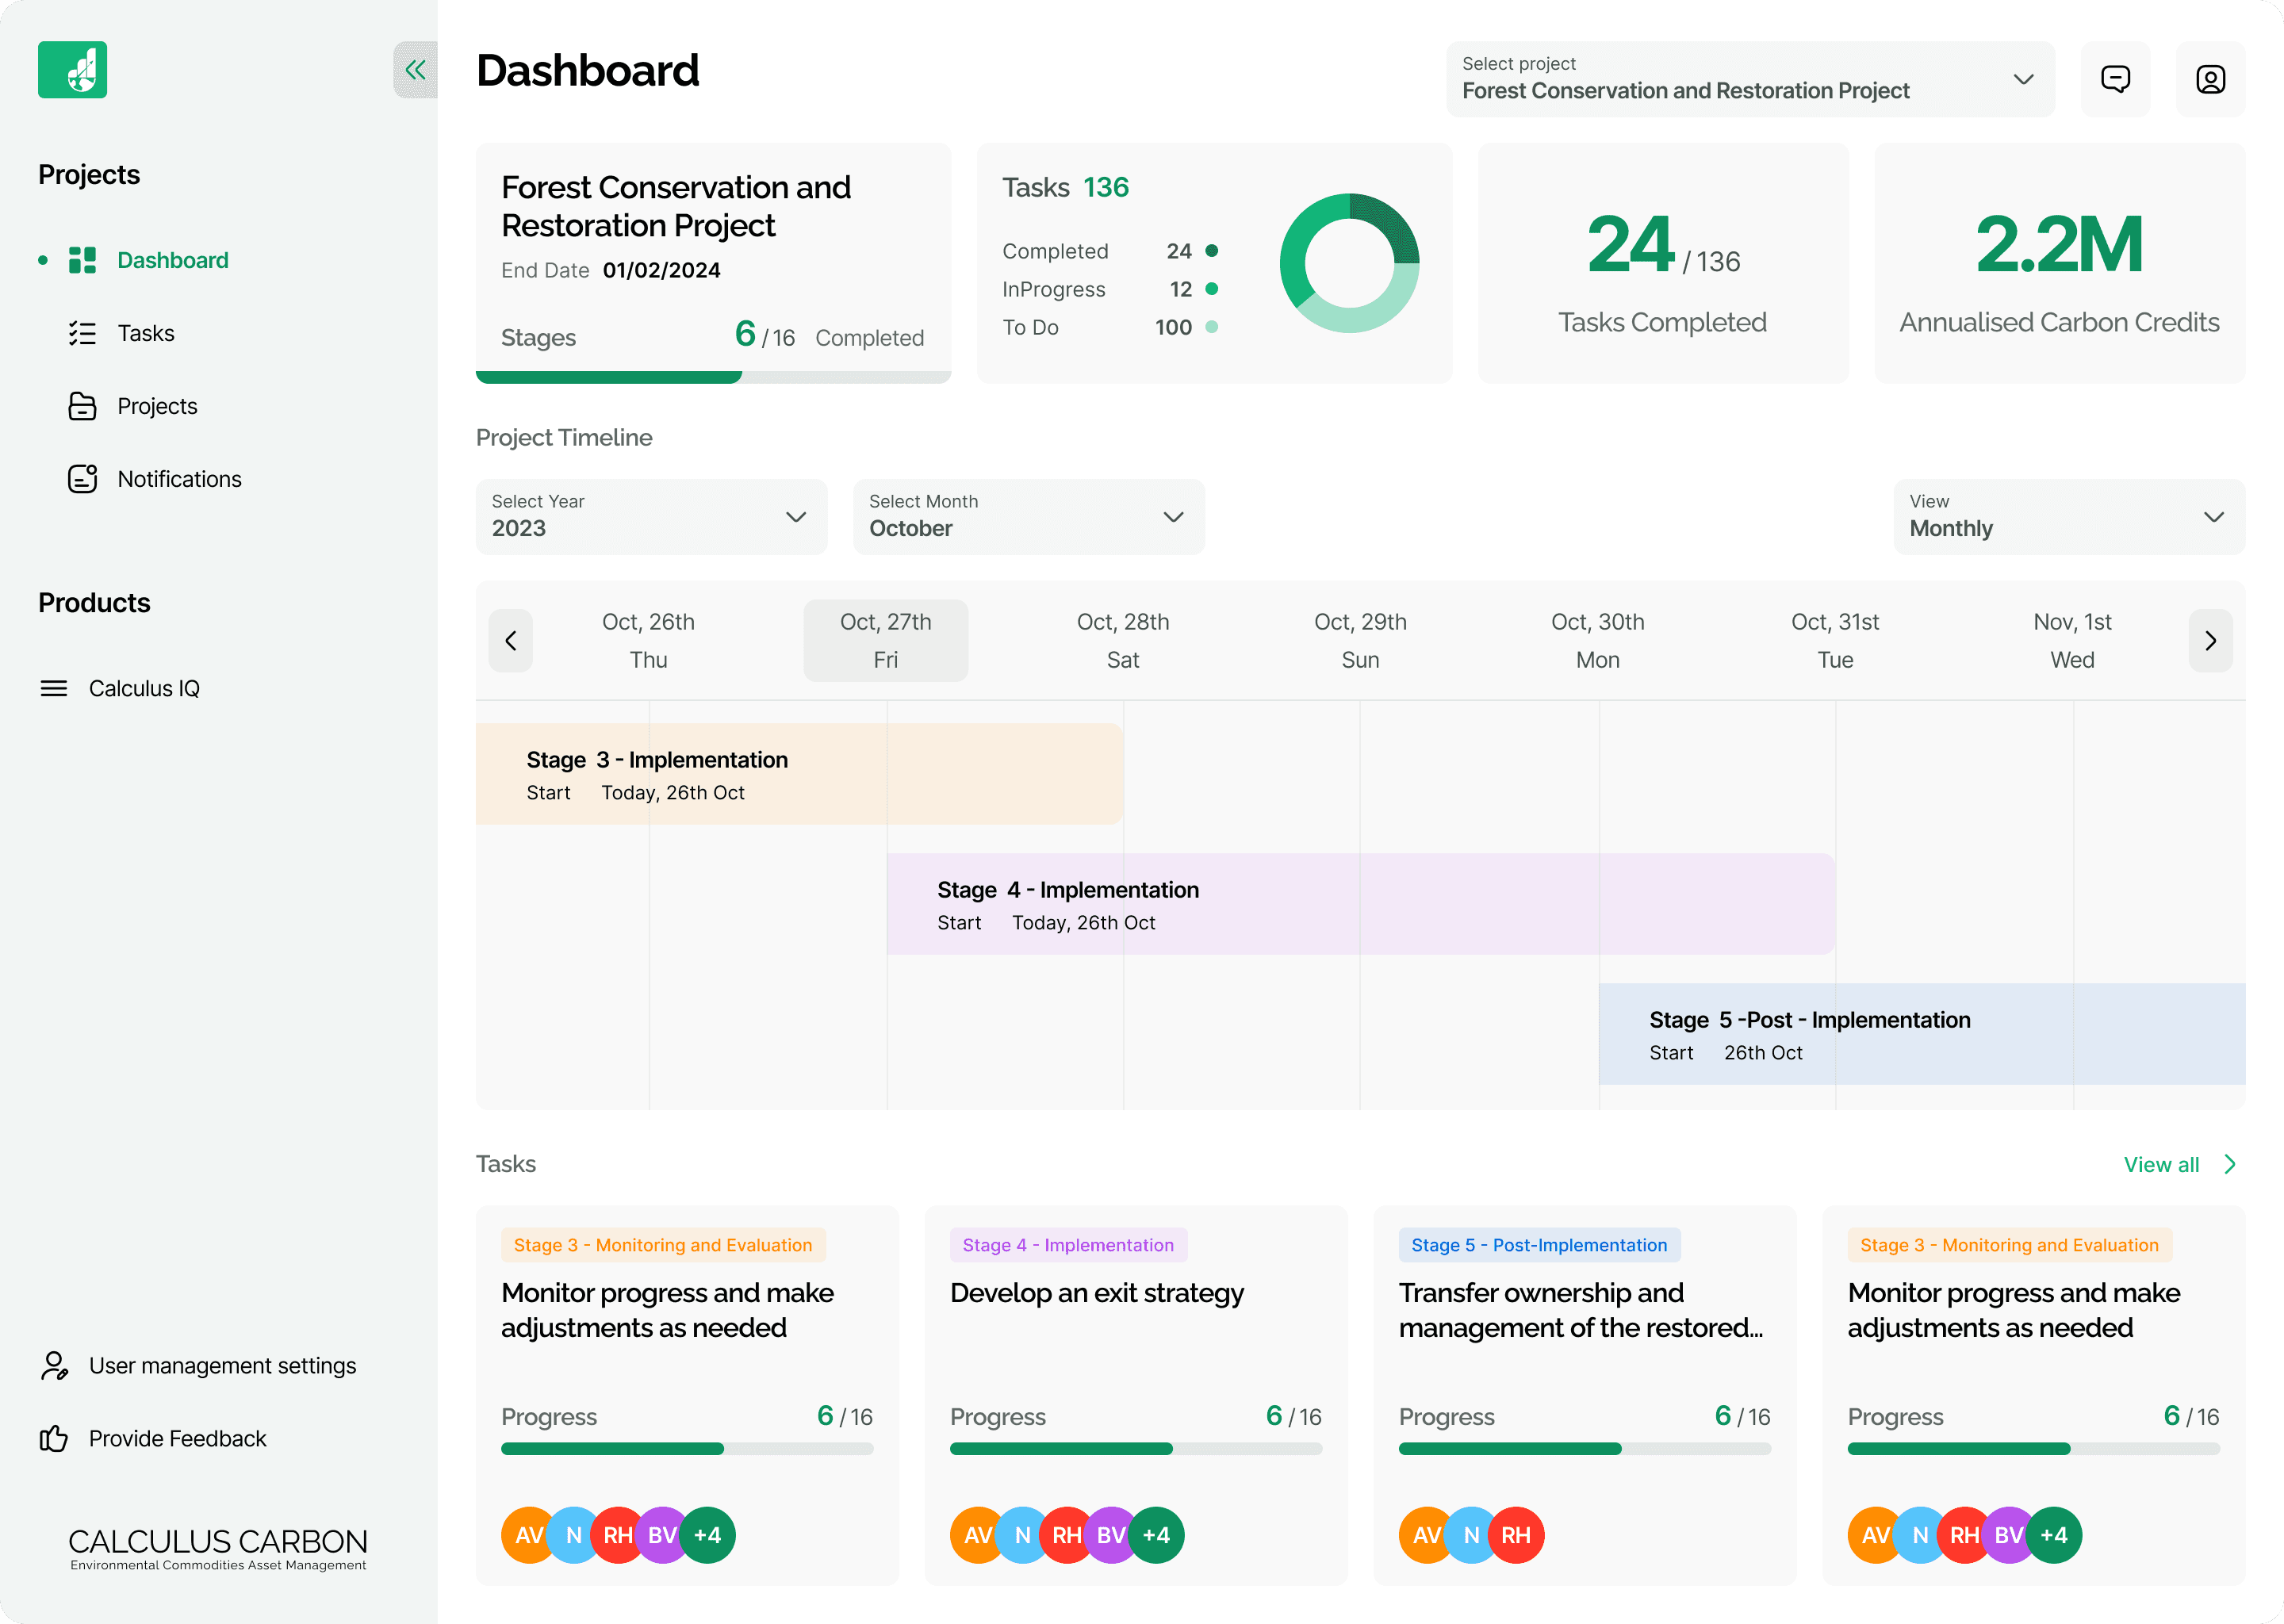
Macro vs. Micro Gantt Charts: Since NbS projects span decades, a standard calendar view fails. I implemented Time-Scale Toggles (Yearly/Quarterly vs. Weekly). This allows Investors to check the 10-year roadmap health, while Developers can zoom in for weekly execution.
Investor-Ready KPIs: The dashboard surfaces "Annualised Carbon Credits" front-and-center, answering the investor's core financial question immediately.
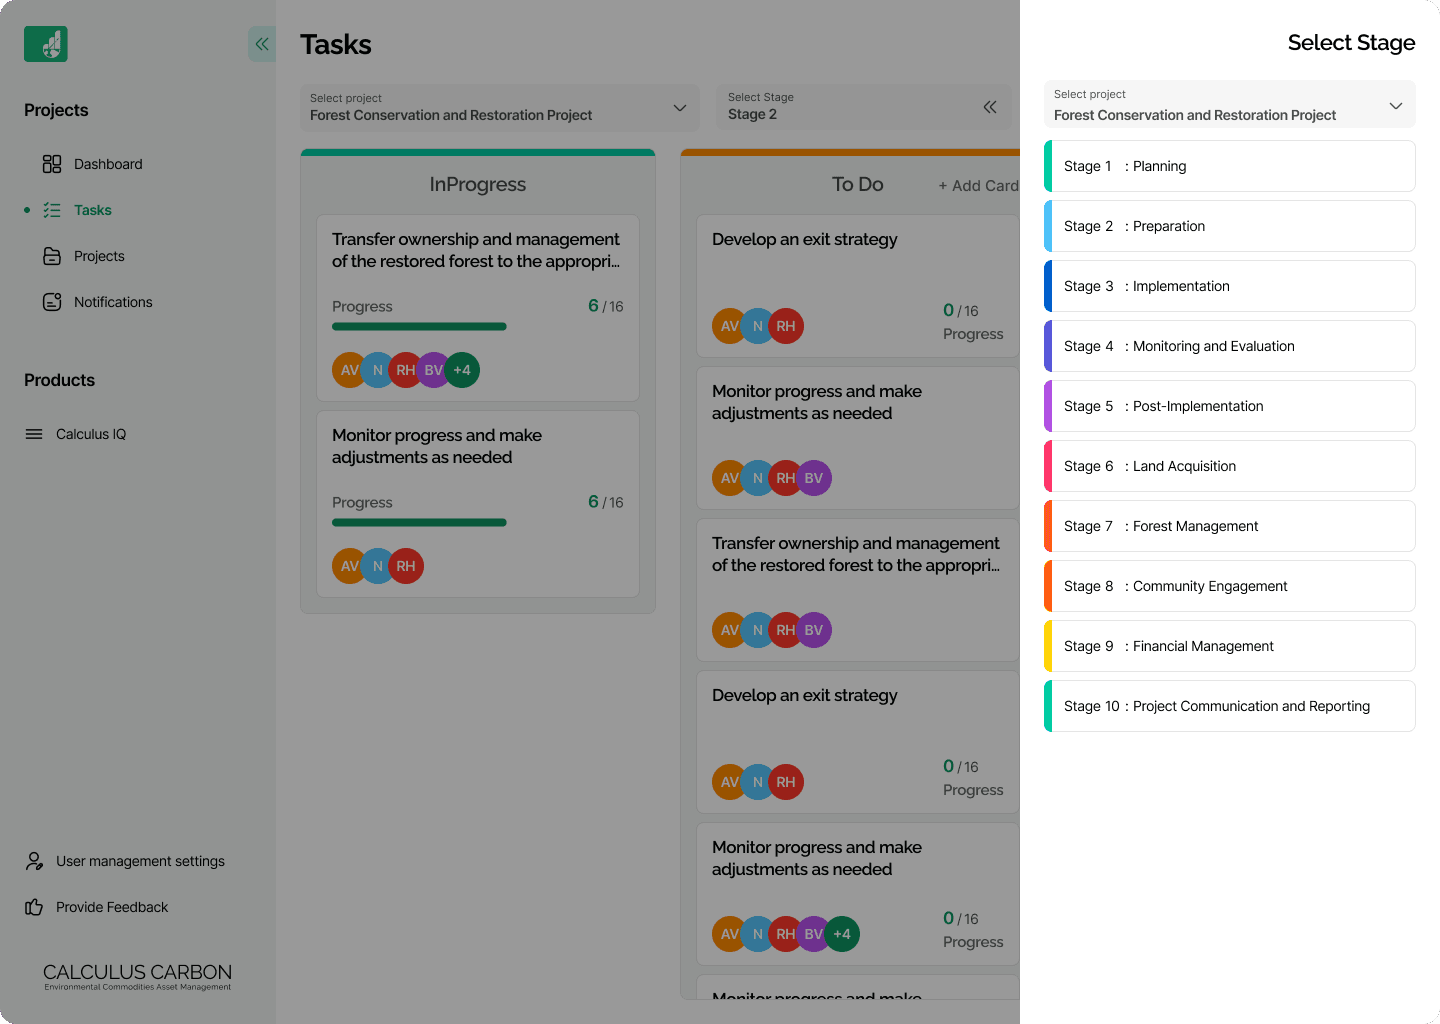
Stage-Gated Navigation: To prevent cognitive overload, the "Stage Selector" (Right Panel) acts as a strict filter. Developers can only interact with the current lifecycle stage (e.g., "Land Acquisition"), preventing "future clutter" from distracting the ground team.
Efficiency Feature: I added a "Copy to Stage" function, allowing Editors to duplicate recurring tasks (like "Annual Soil Test") across multiple stages instantly.
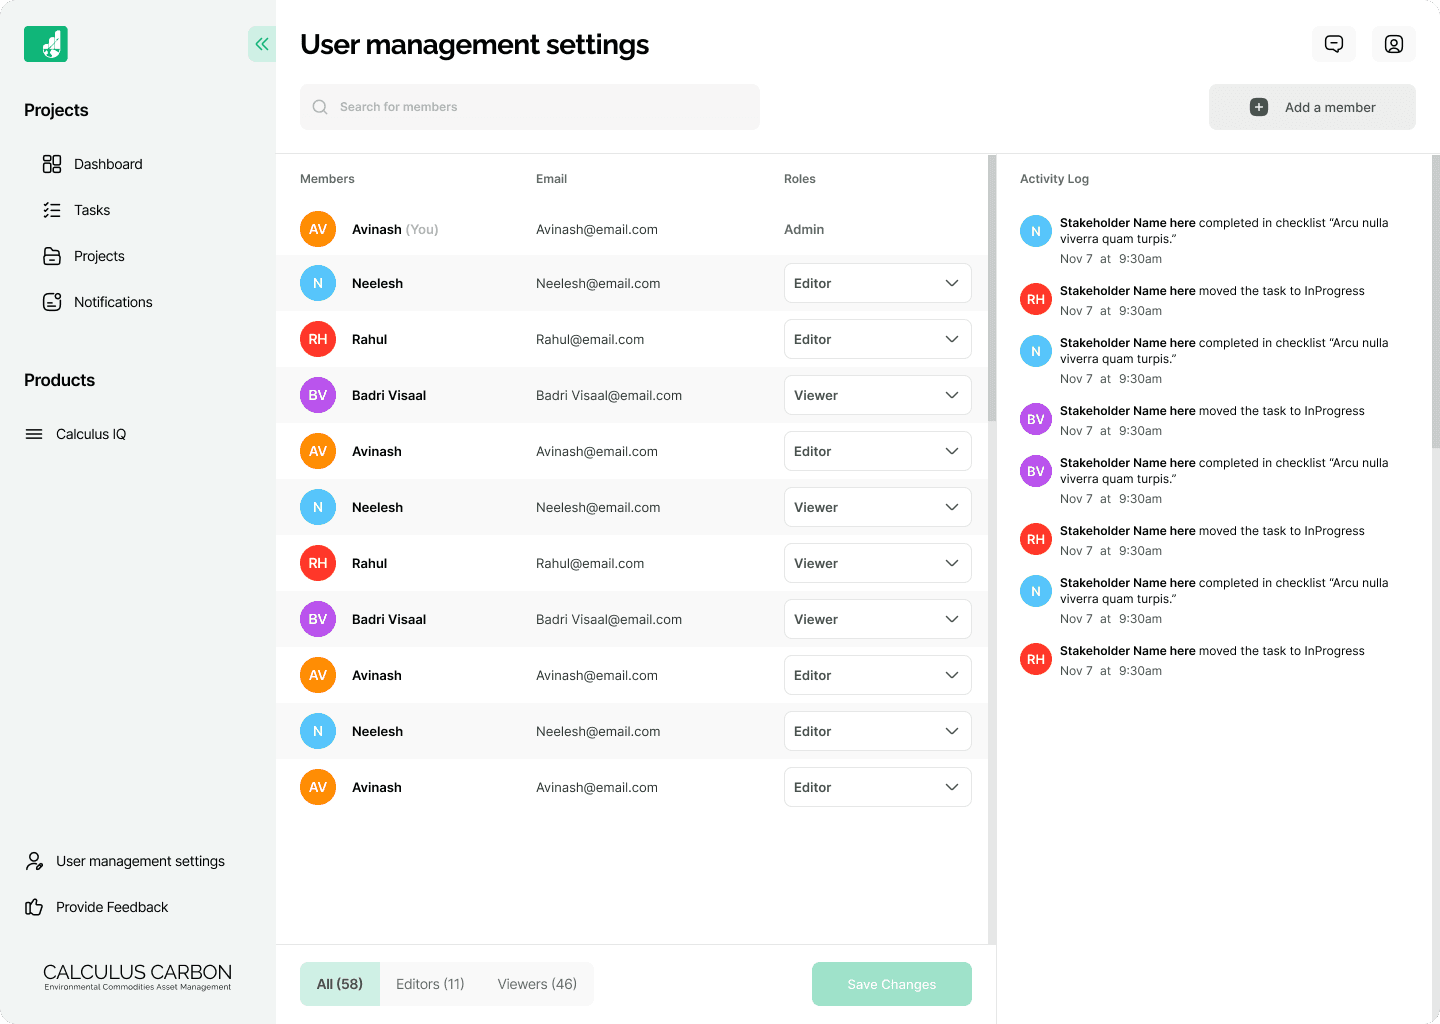
Role-Based Guardrails: I designed a strict permission hierarchy to protect sensitive "Service Details" (POCs, Contracts) which are only visible to Admins.
Viewers (Ground Staff): See only "Assigned to Me" tasks.
Admins (Calculus Internal): Have a "Mirrored View" of the frontend to audit developer progress in Read-Only mode.
The Audit Trail: Every action is captured in a granular Activity Log, creating a permanent record of who moved a task or edited a checklist item.
The Dev Handshake (Efficiency)
Constraint: A strict 1-month MVP deadline.
Execution: Instead of building custom components from scratch, I audited the Developer's preferred UI Library. I created a "Parallel Style Guide" that applied our branding on top of their existing components. This allowed us to reuse complex logic (like the Gantt scrolling behavior) across both Developer and Admin dashboards, cutting frontend dev time by ~40%.
Retrospective
The Win: The system replaced manual status emails with a self-serve dashboard. The Activity Log provided the necessary accountability for remote teams, significantly reducing the "management overhead" for the Ops team.
V2 Improvement: Currently, shifting a stage's timeline is manual. In the next iteration, I would implement "Smart Dependencies"—so if "Stage 3" is delayed by a week, "Stage 4" start dates automatically shift, giving investors realistic risk forecasting.

